
Financial Results
Balance Sheet structure, KZT million end of period
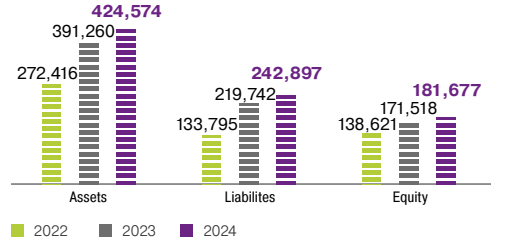
The Company’s total assets increased by 8.5 % in 2024, reaching KZT 424.5 billion. This growth was primarily driven by an increase in the value of property, plant and equipment and intangible assets.
Equity grew by 6 %, while liabilities rose by 10.5 %, mainly due to higher long-term borrowings and long-term lease liabilities.
Profit Performance, KZT million over the period
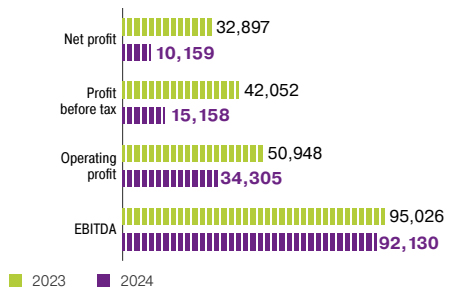
The Company’s operating profit decreased by 32.6 % year-on-year, primarily due to record capital expenditures related to network upgrades and the rollout of 5G. Substantial investments were made in building and modernising base stations, as well as in new technology development, all of which required significant funding.
Revenue Structure from Core Operations in 2024
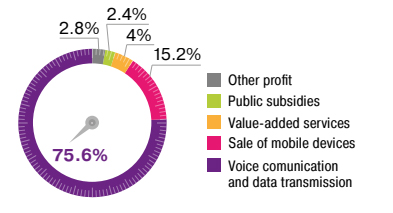
Revenue from the Company’s core business operations increased by 5.2 % compared to 2023, reaching KZT 235.4 billion. Voice and data services accounted for 76 % of total core revenue, followed by sales of mobile devices and equipment as the second-largest revenue stream.
Core Operating Revenue, KZT million over the period
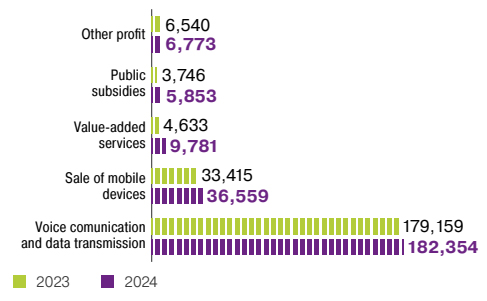
Revenue from voice and data services increased by 1.8 % compared to 2023, while revenue from the sale of mobile devices and equipment declined by 9.4 %.
Cost Structure in 2024
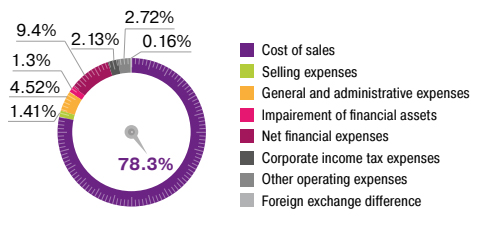
The largest share in the Company’s cost structure is attributed to the cost of sales, accounting for 78.3 % of total expenses. Other significant components include finance costs (9.4 %) and general and administrative expenses (4.5 2%). All other expense categories combined make up approximately 7.6 % of total expenses.
Investments and Capital Expenditures, KZT million over the period
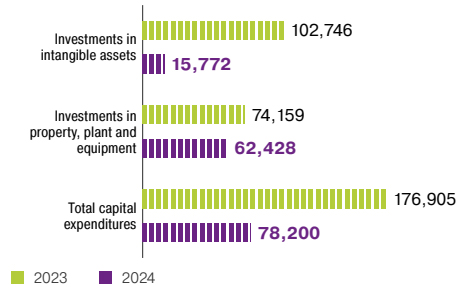
Capital expenditures decreased compared to 2023 and amounted to KZT 78.2 billion. Investments in intangible assets totaled KZT 15.7 billion, while investments in property, plant, and equipment reached KZT 62.4 billion.
Cash Flows, KZT million over the period
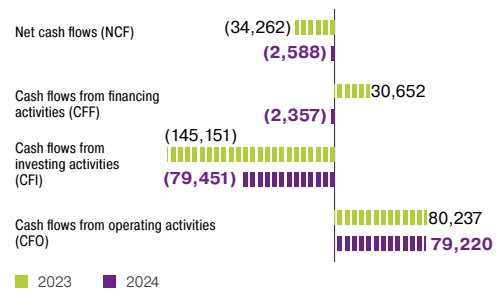
Cash flow from operating activities decreased by KZT 1.0 billion compared to 2023 and totaled KZT 79.2 billion. At the same time, net cash flow remained negative at minus KZT 2.6 billion (compared to minus KZT 34.3 billion in 2023).
The negative cash flow from investing activities decreased primarily due to lower spending on the acquisition of intangible assets.
Cash flow from financing activities was also negative (minus KZT 2.4 billion, compared to KZT 30.7 billion in 2023) due to a significant increase in loan repayments.
Profitability Indicators
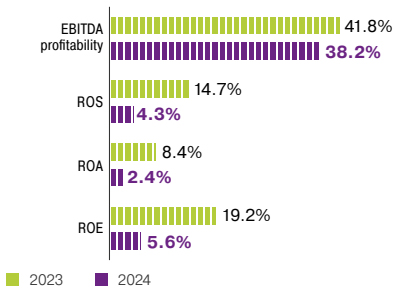
The decline in net profit, driven by higher cost of sales and operating expenses, resulted in a decrease across all key profitability metrics.
Return on assets (ROA) dropped from 8.4 % to 2.4 %, return on sales declined from 14.7 % to 4.3 %, and return on equity (ROE) decreased from 19.2 % to 5.6 %. EBITDA margin also declined, from 41.8 % to 38.2 %.